| Home > Weather > yeargraph | ||
The weather in One Mile Beach NSW - Australia(152º 06' 48" E - 32º 46' 14" S) |
||
| Add this webpage to your Favorites | Some years in Graphs |
|
|
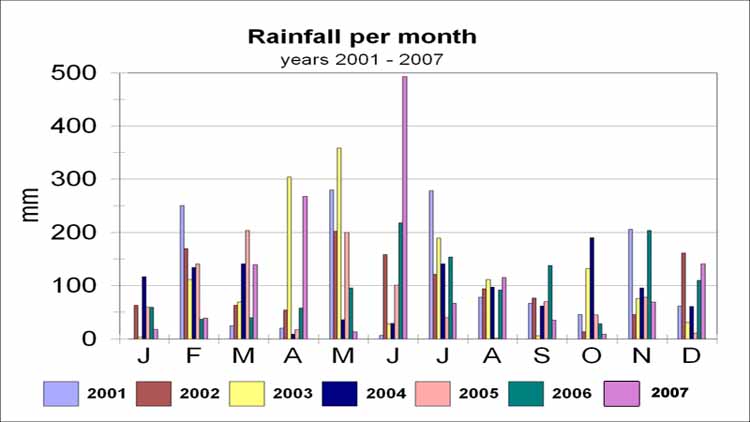
Rainfall per month.
The amount of rain varies per months and per year. The wettest months are usually April and May but not every year... |
||
|
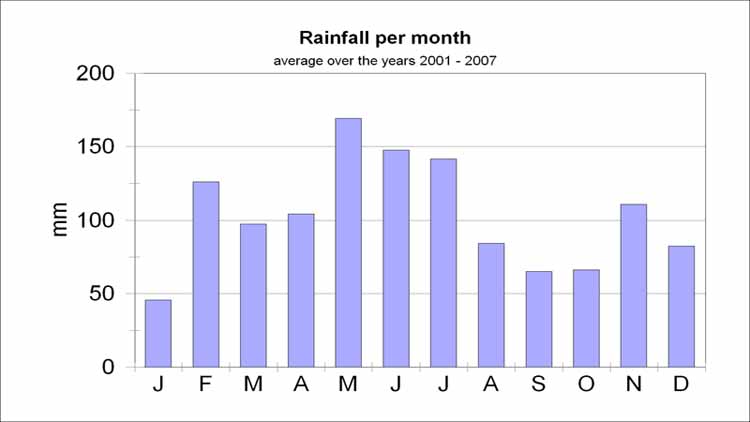
Average rainfall per month.
|
||
|
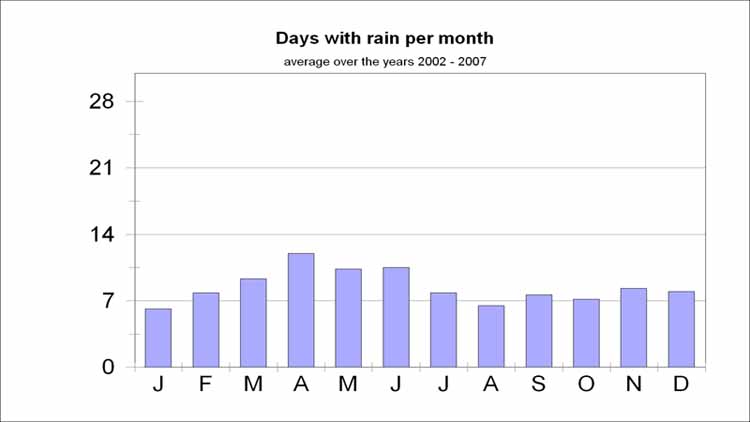
Average number of days with rain per month.
This includes days with only very light precipitation and rainfall "overnight". Observation periods are from 09:00 local time - 09:00 local the next morning. |
||
|
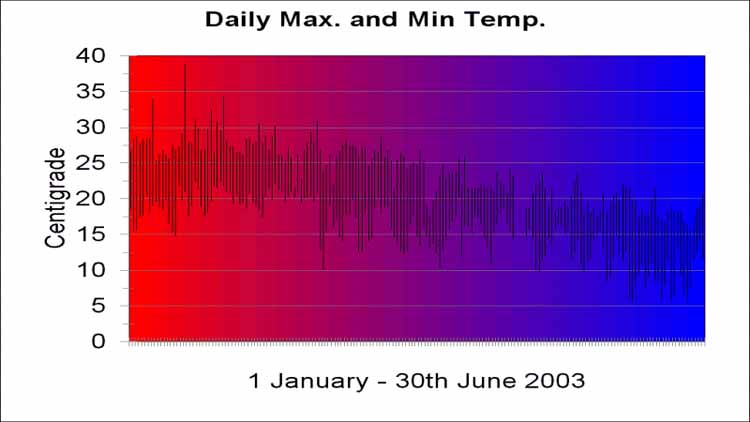
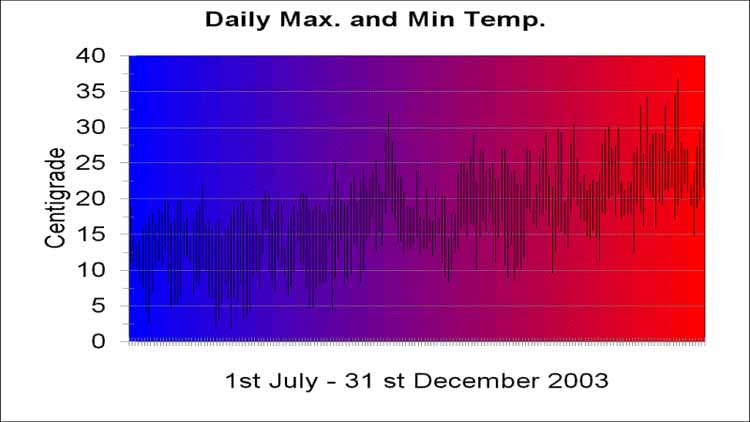
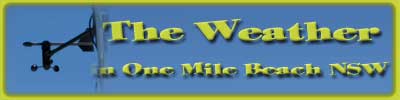
Daily max. and minimum temperatures over the years 2003 and 2004.
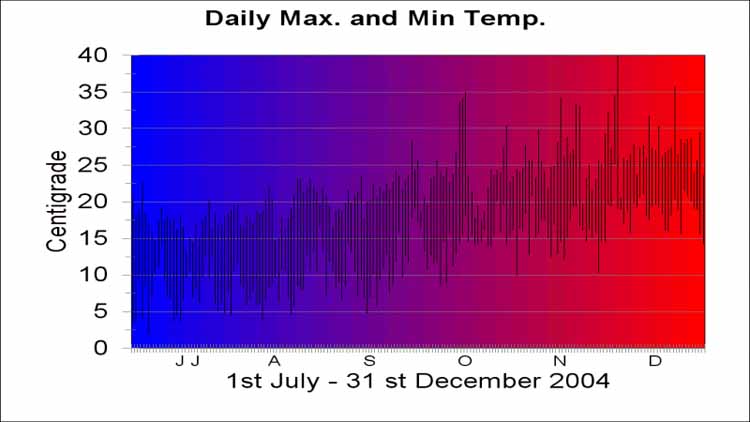
All graphs are based on observations at my weather station in One Mile Beach NSW. We have usually more moderate temperatures compared to locations like Sydney, Newcastle and the Hunter Valley. On the other hand we do not suffer from drought and have more rainfall than locations further inland. |
||
Webdesign and Hosted by
|
||
Go to the top of the page |
||